Justuno Analytics Platform

The Problem
Justuno was sitting on significantly more data than it was surfacing to clients. The existing analytics were minimal, useful enough to confirm something was running but not useful enough to make decisions from. Clients had no real visibility into how their promotions were performing or how visitors were actually moving through their on-site experiences.
The goal was to build something that changed that entirely.
The Work
I joined a two-person team as the designer and frontend developer. My collaborator handled the data layer. I owned everything the client would actually see and interact with, all nine pages of the platform, every chart, every visualization, built in React and HighCharts.
It was my first production React project. I was largely thrown into the deep end, which meant learning fast and building at the same time. The backend developer stepped in when I got stuck but the frontend was mine to figure out.
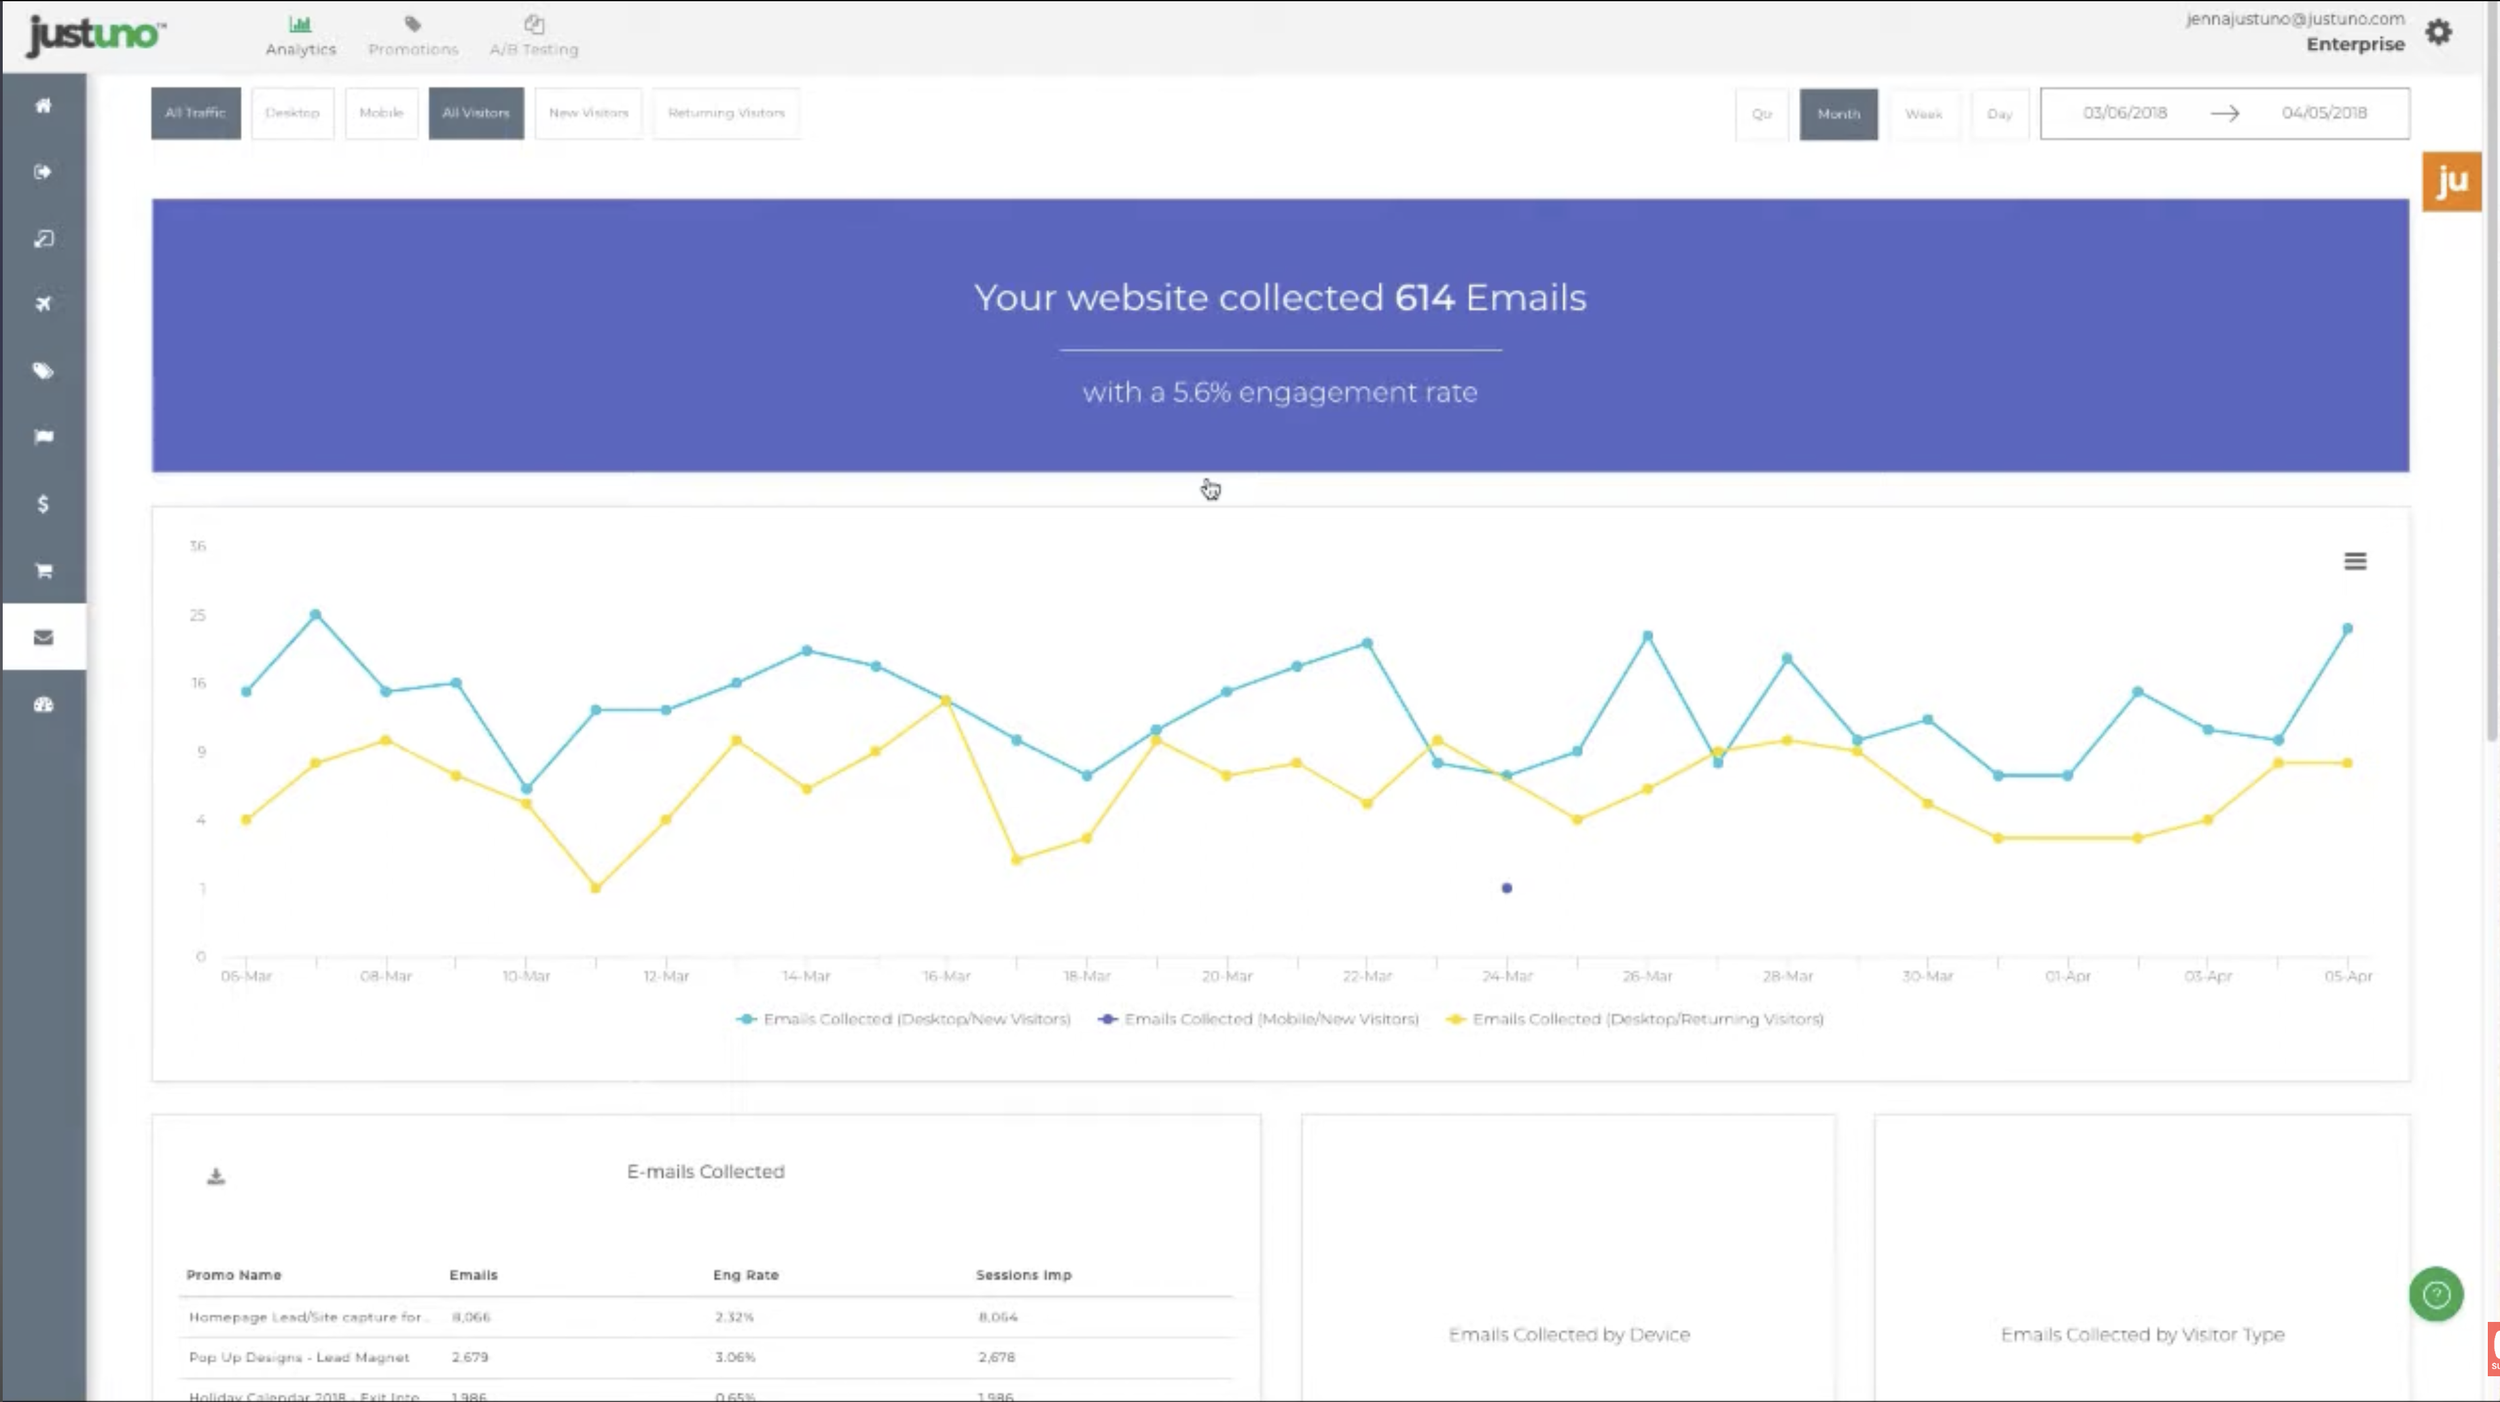
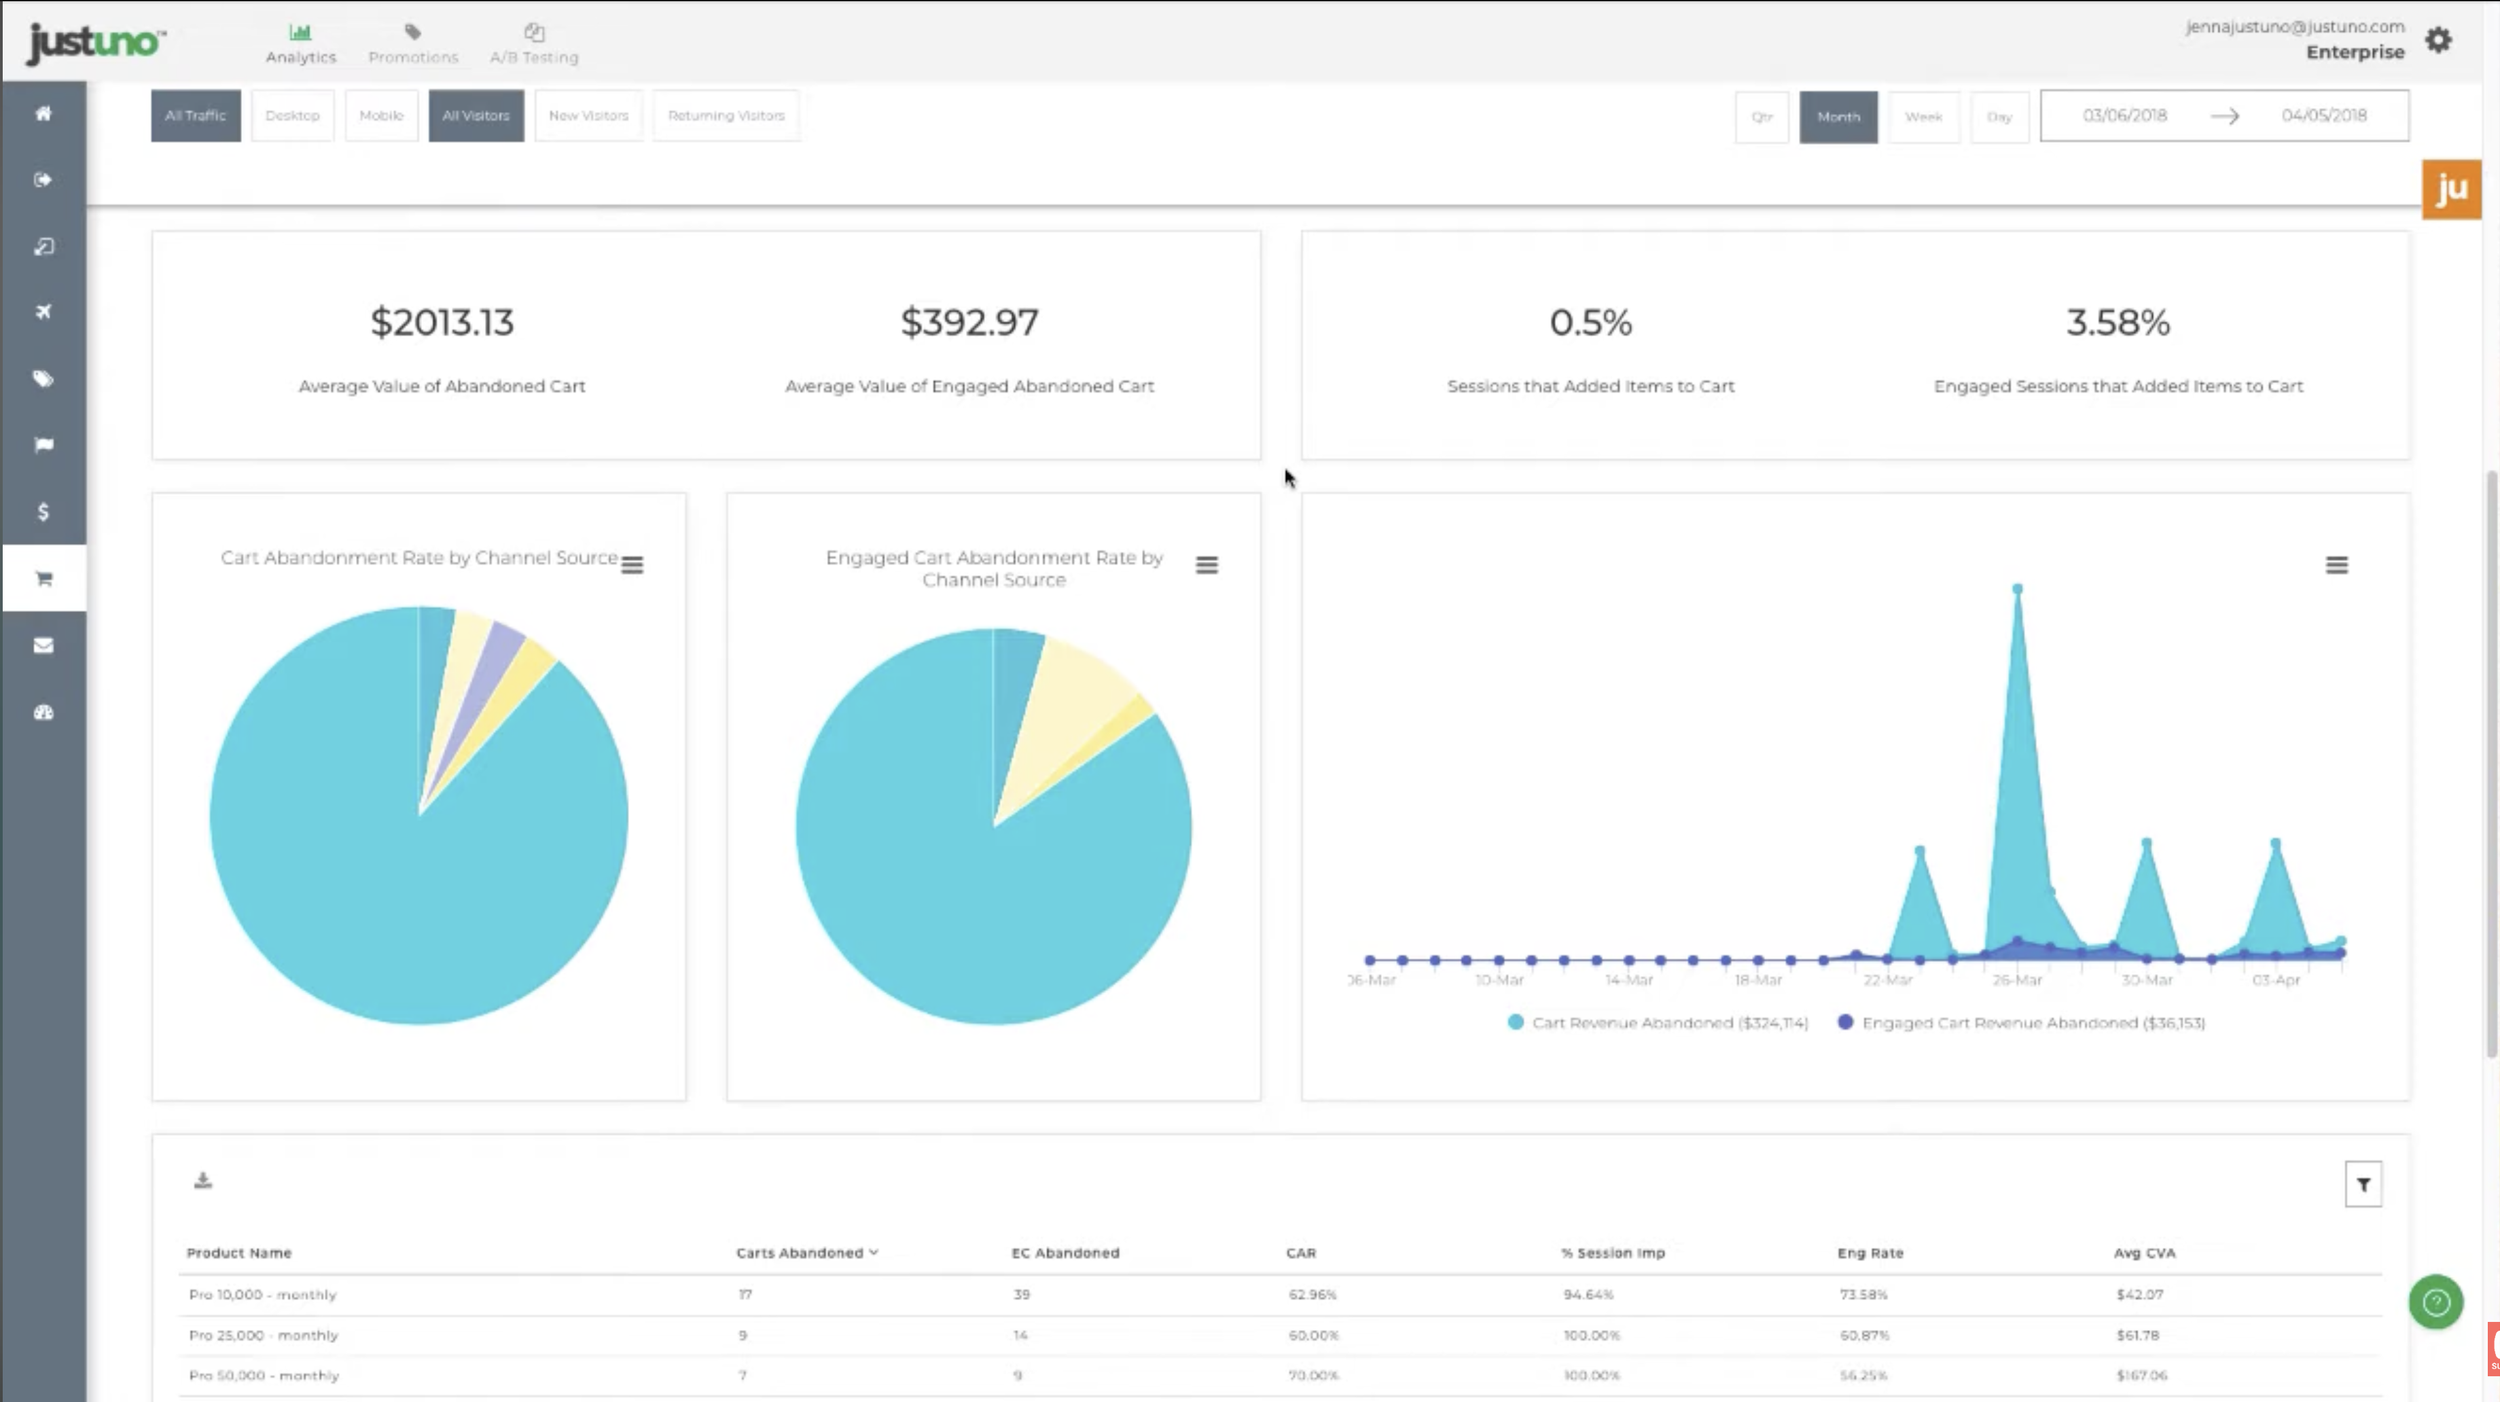
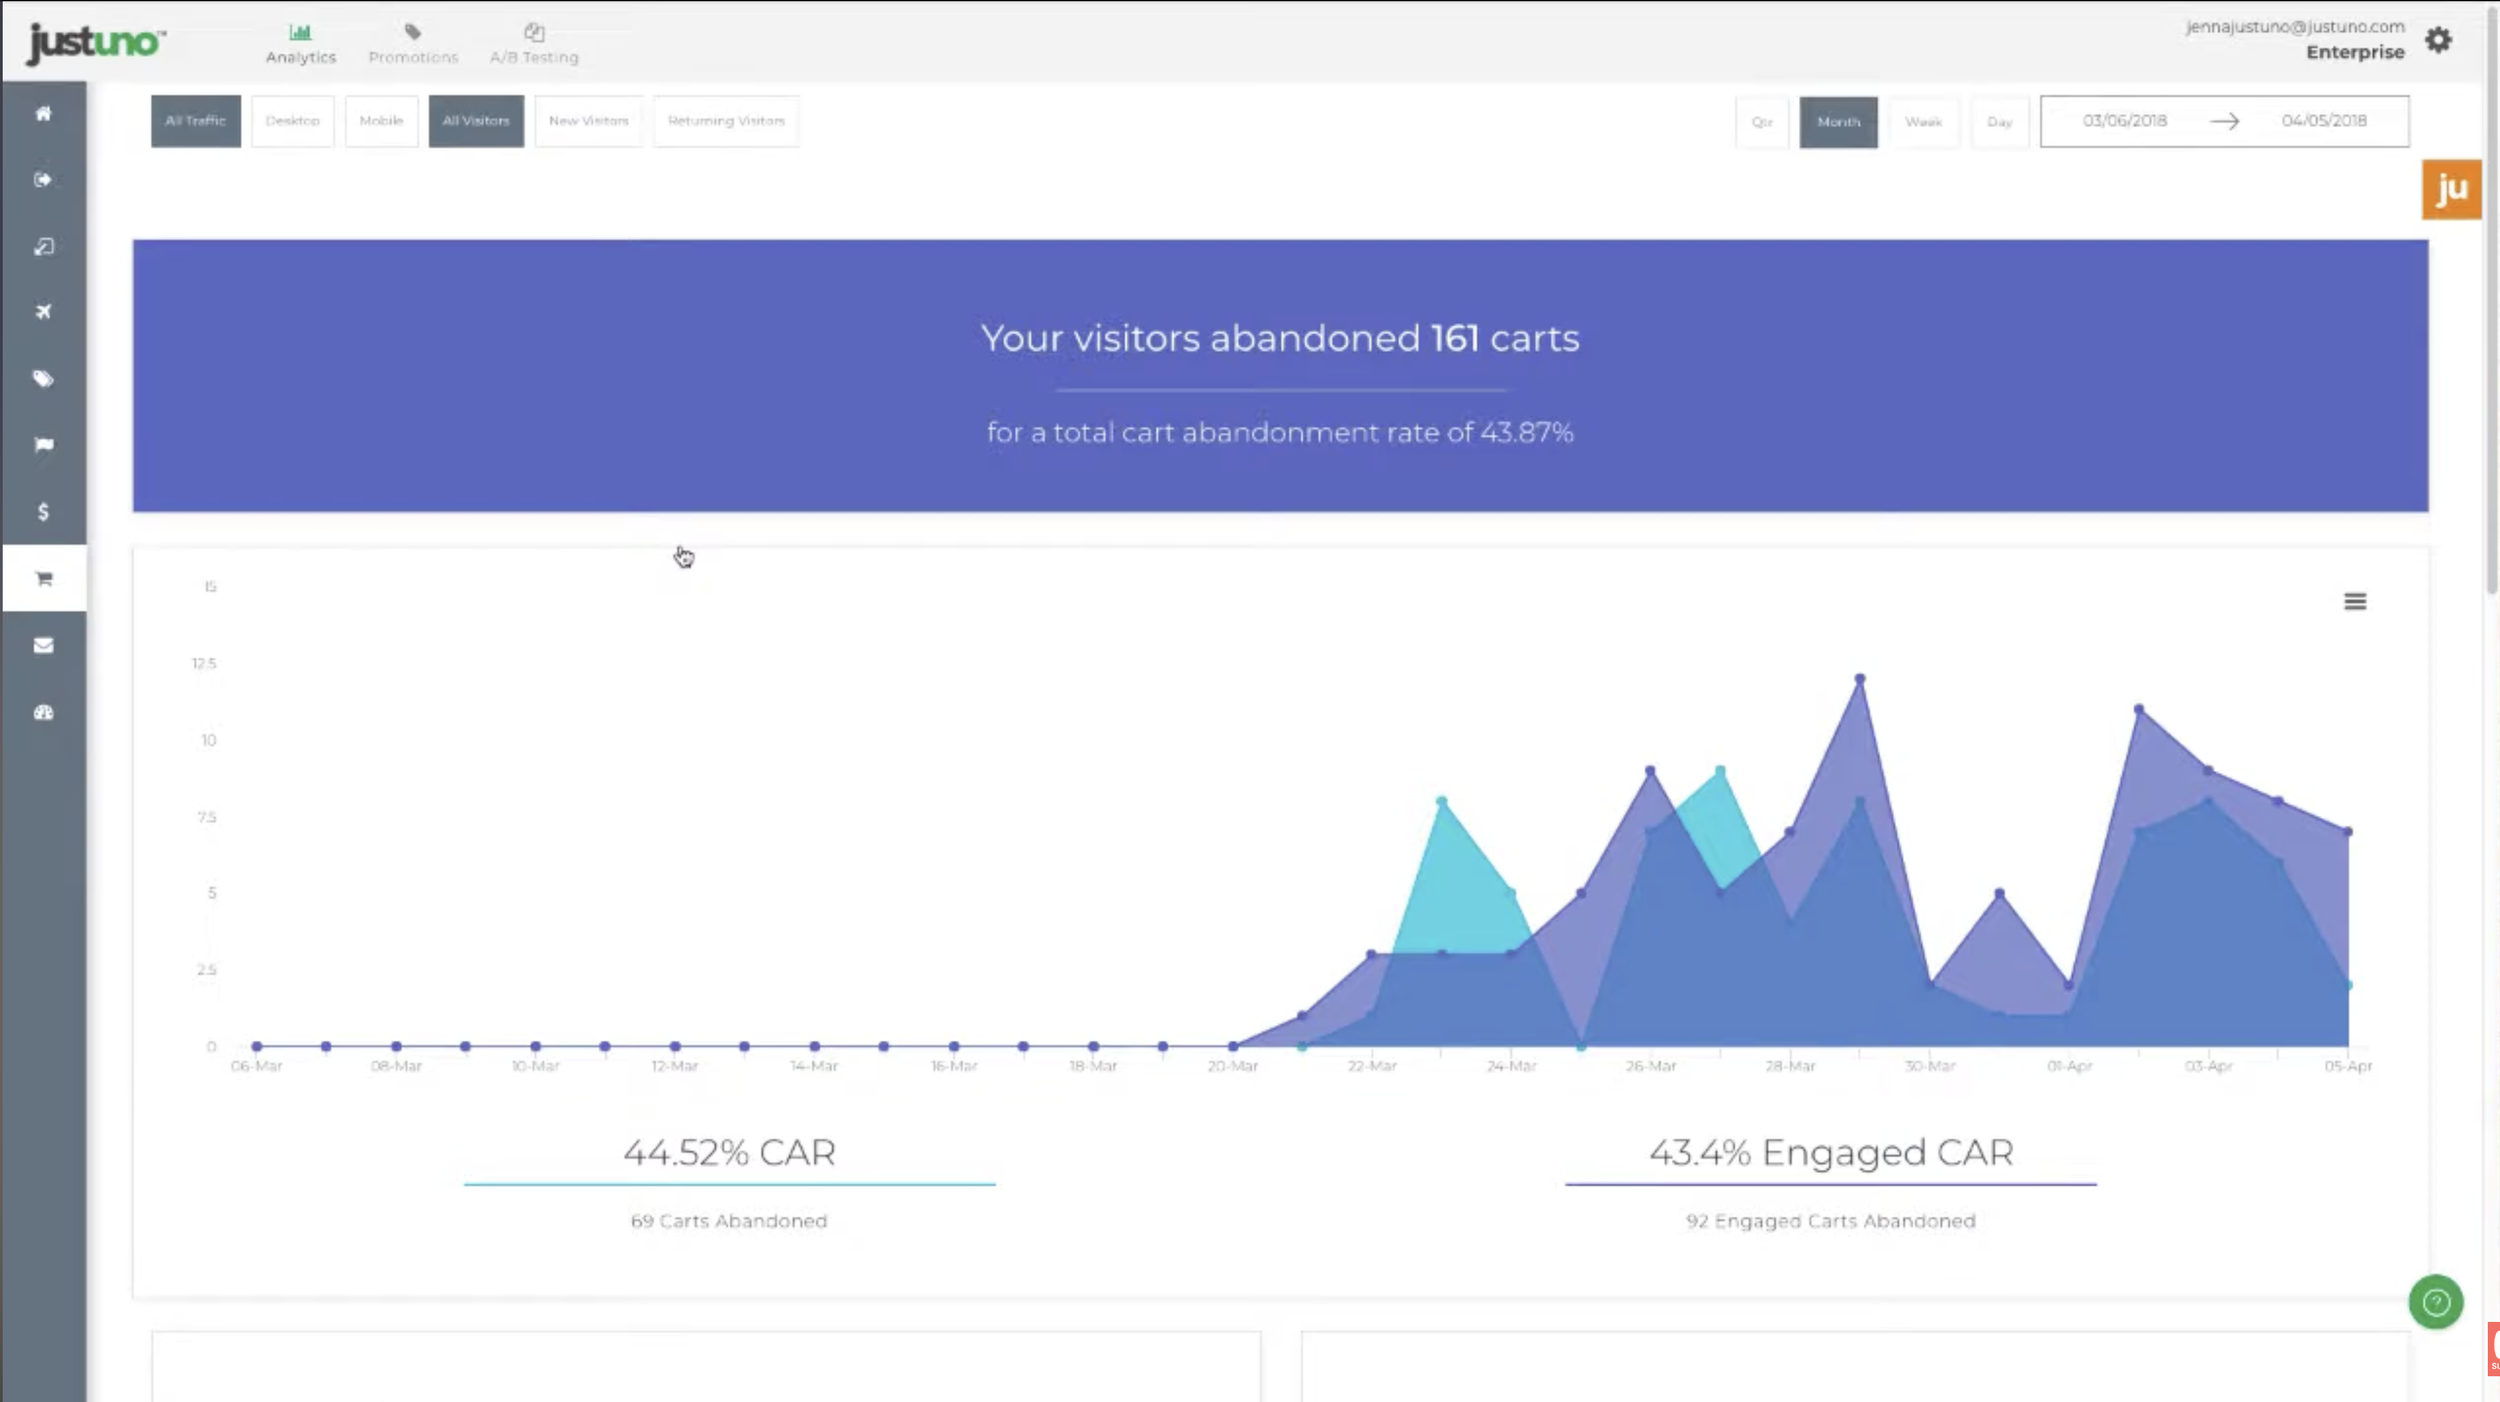
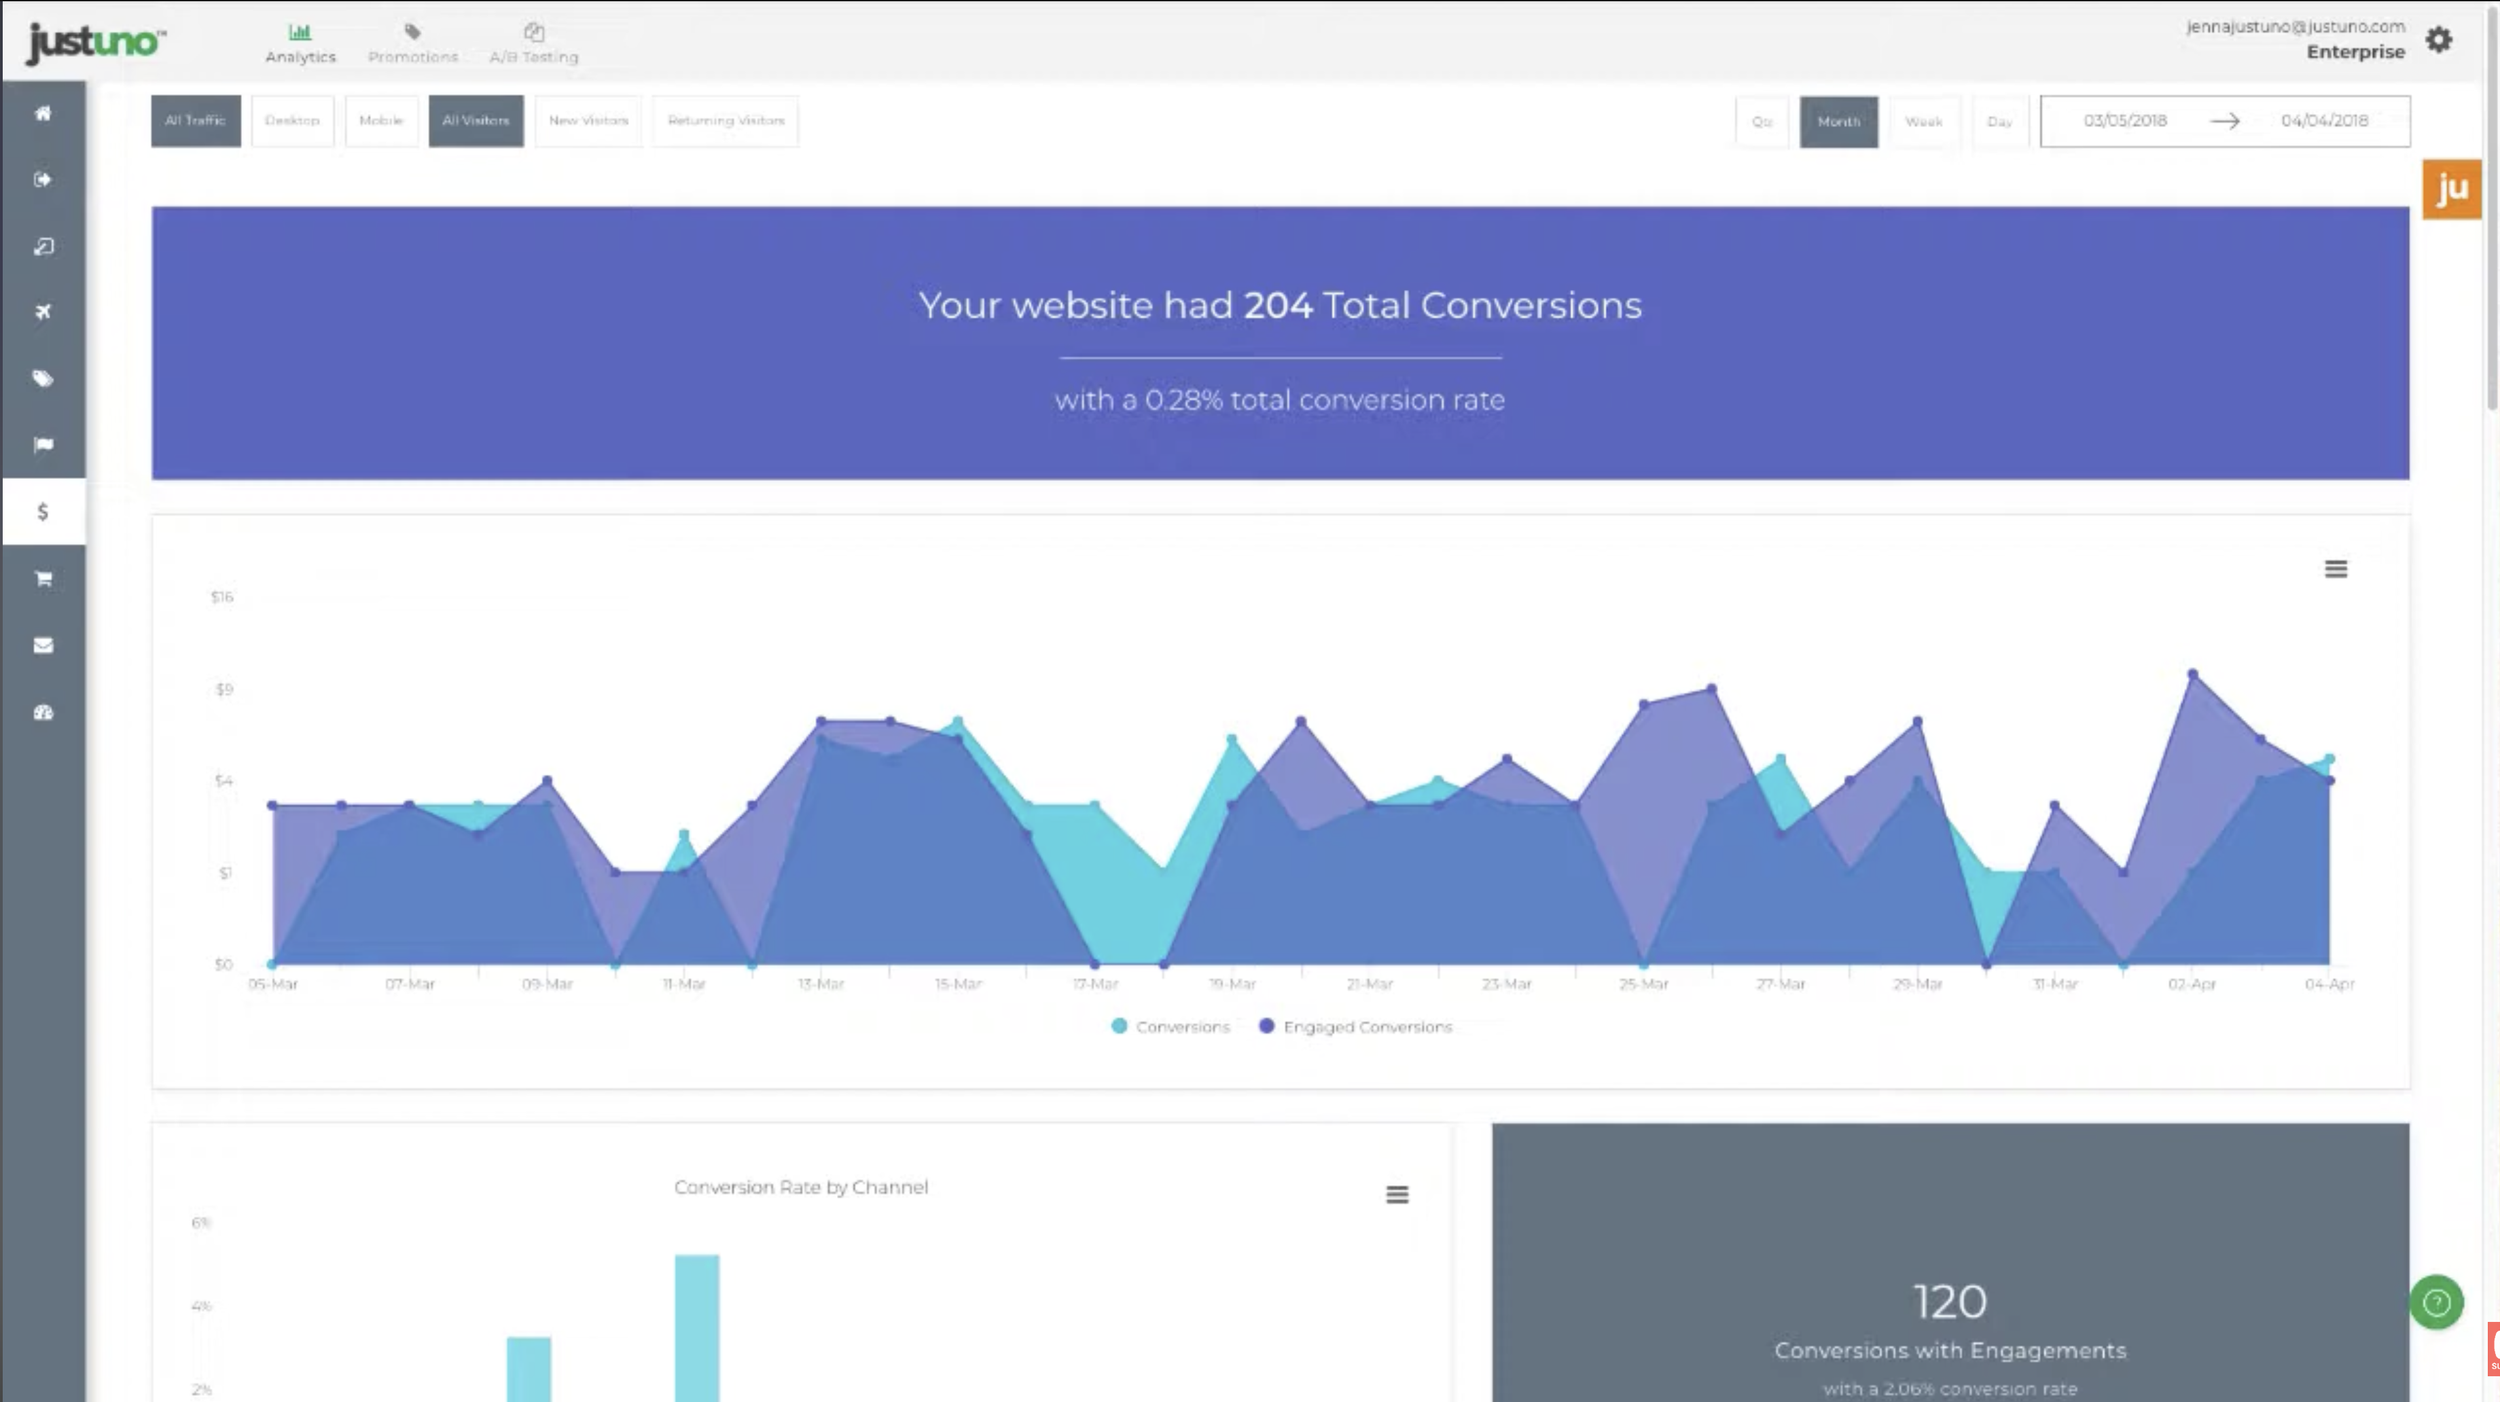
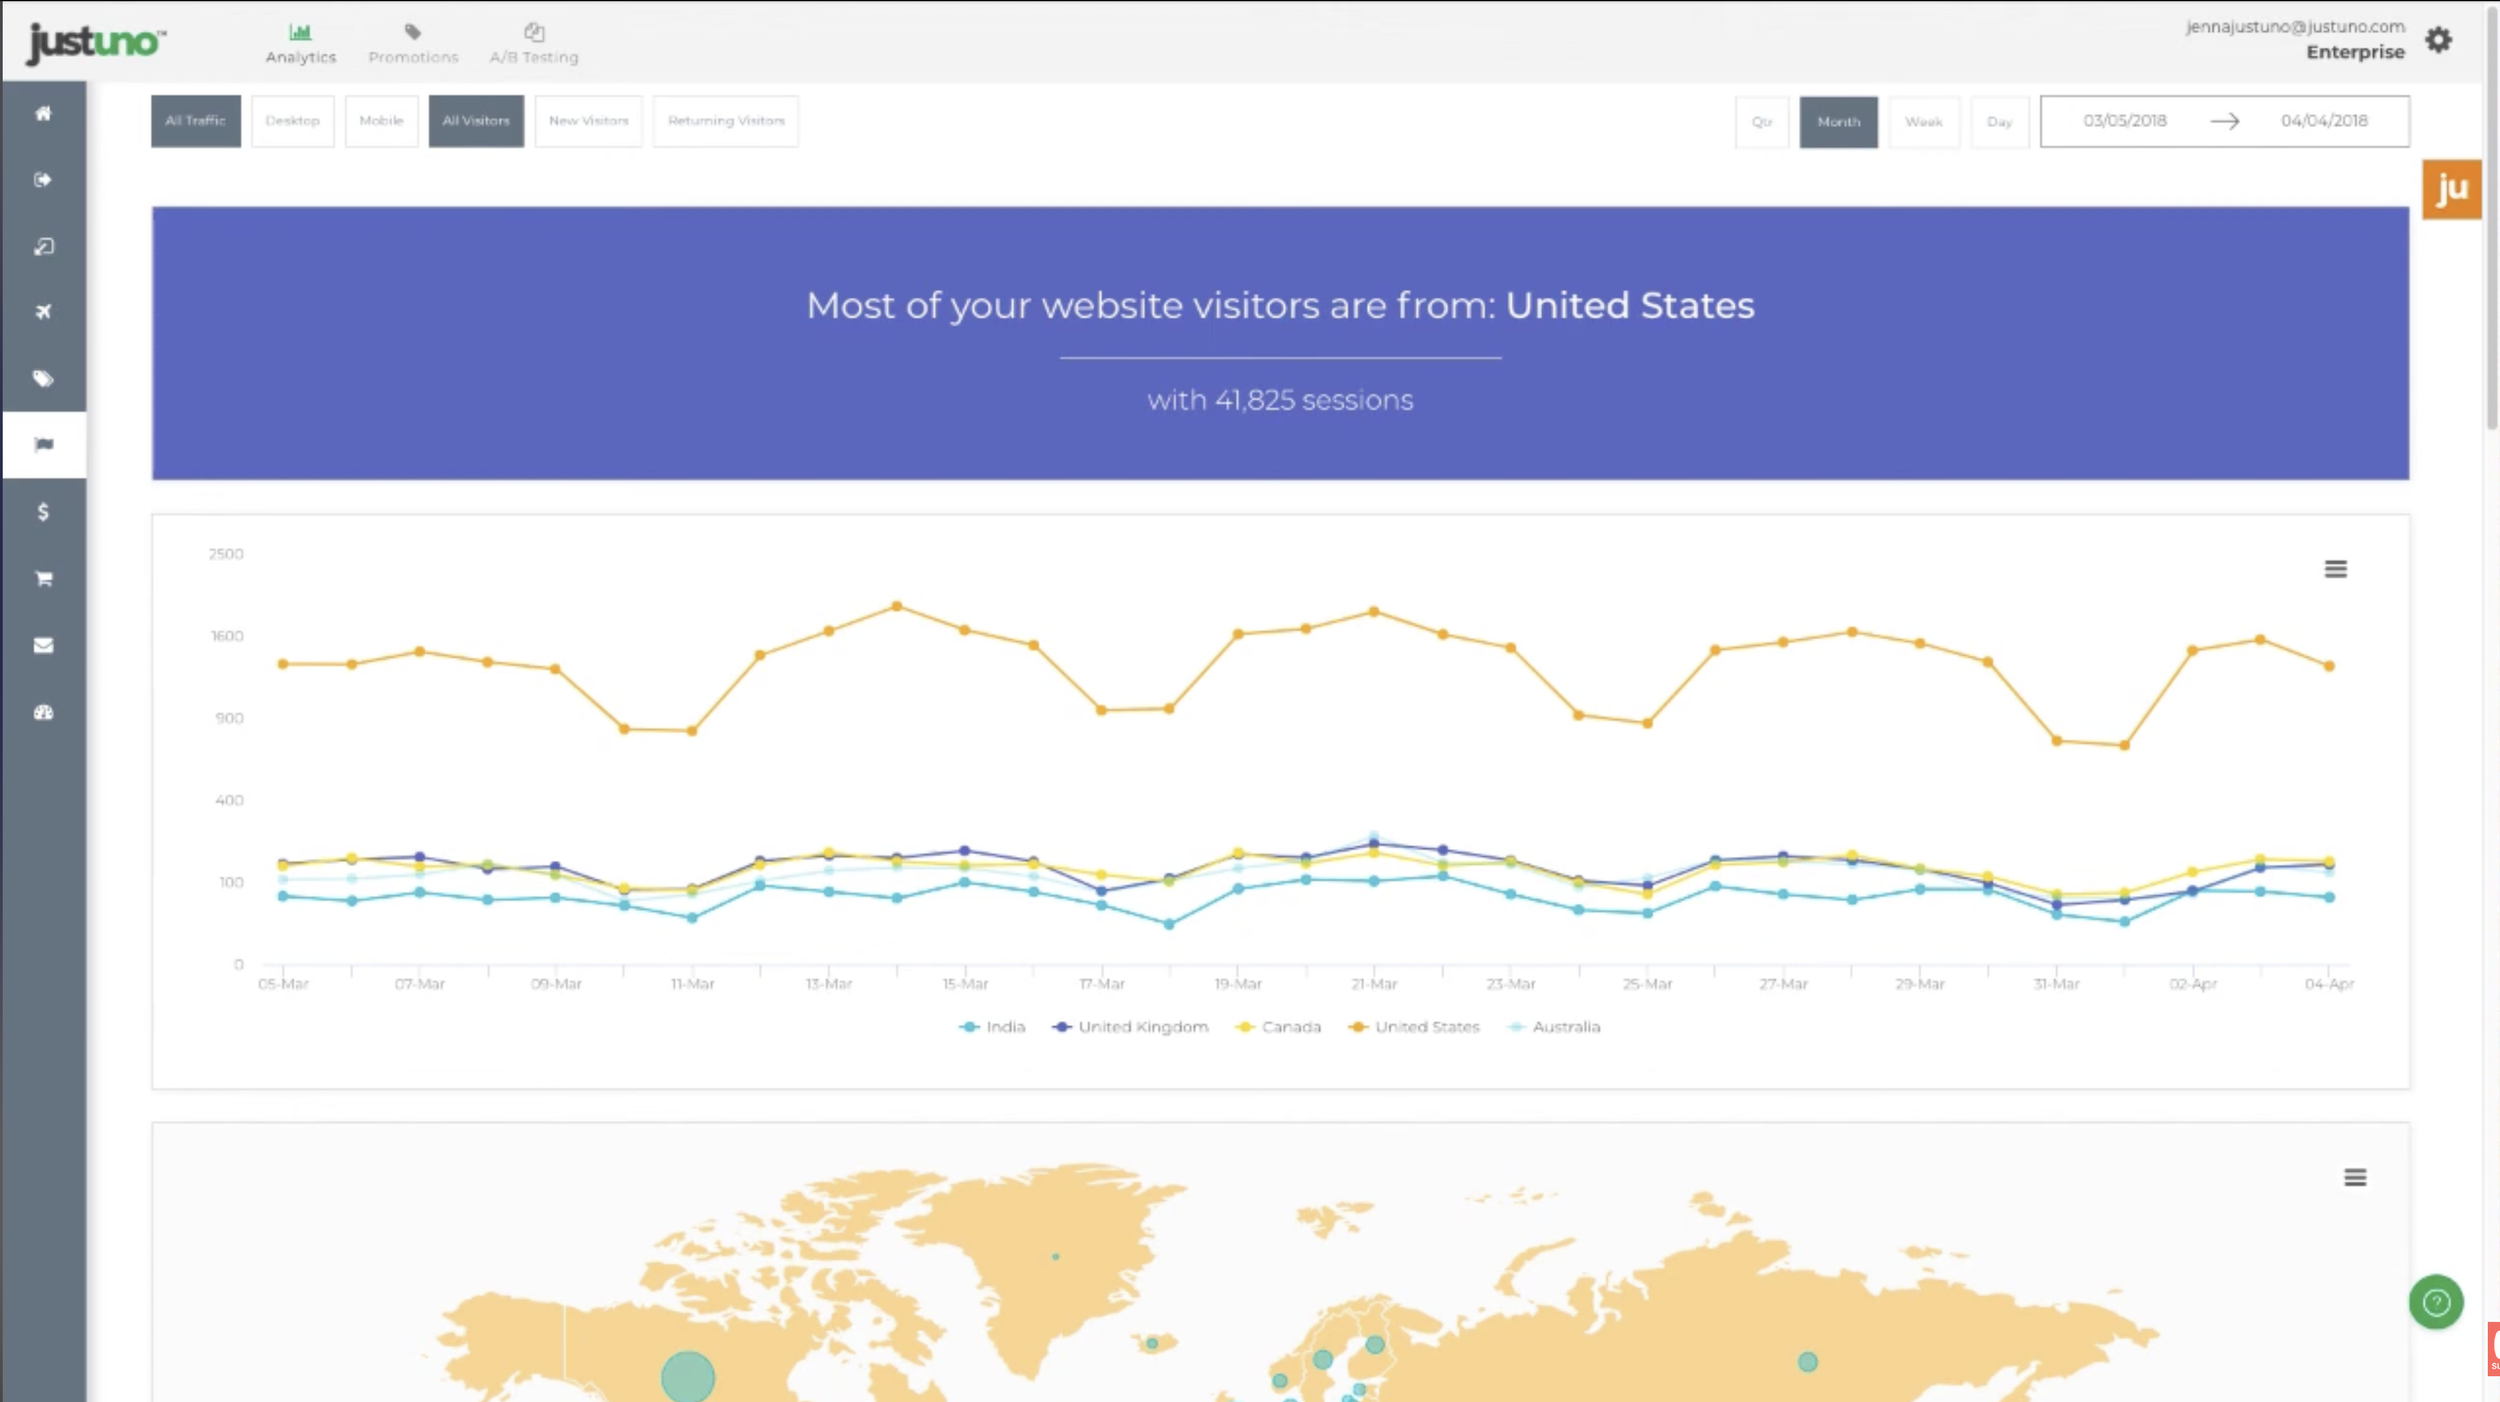
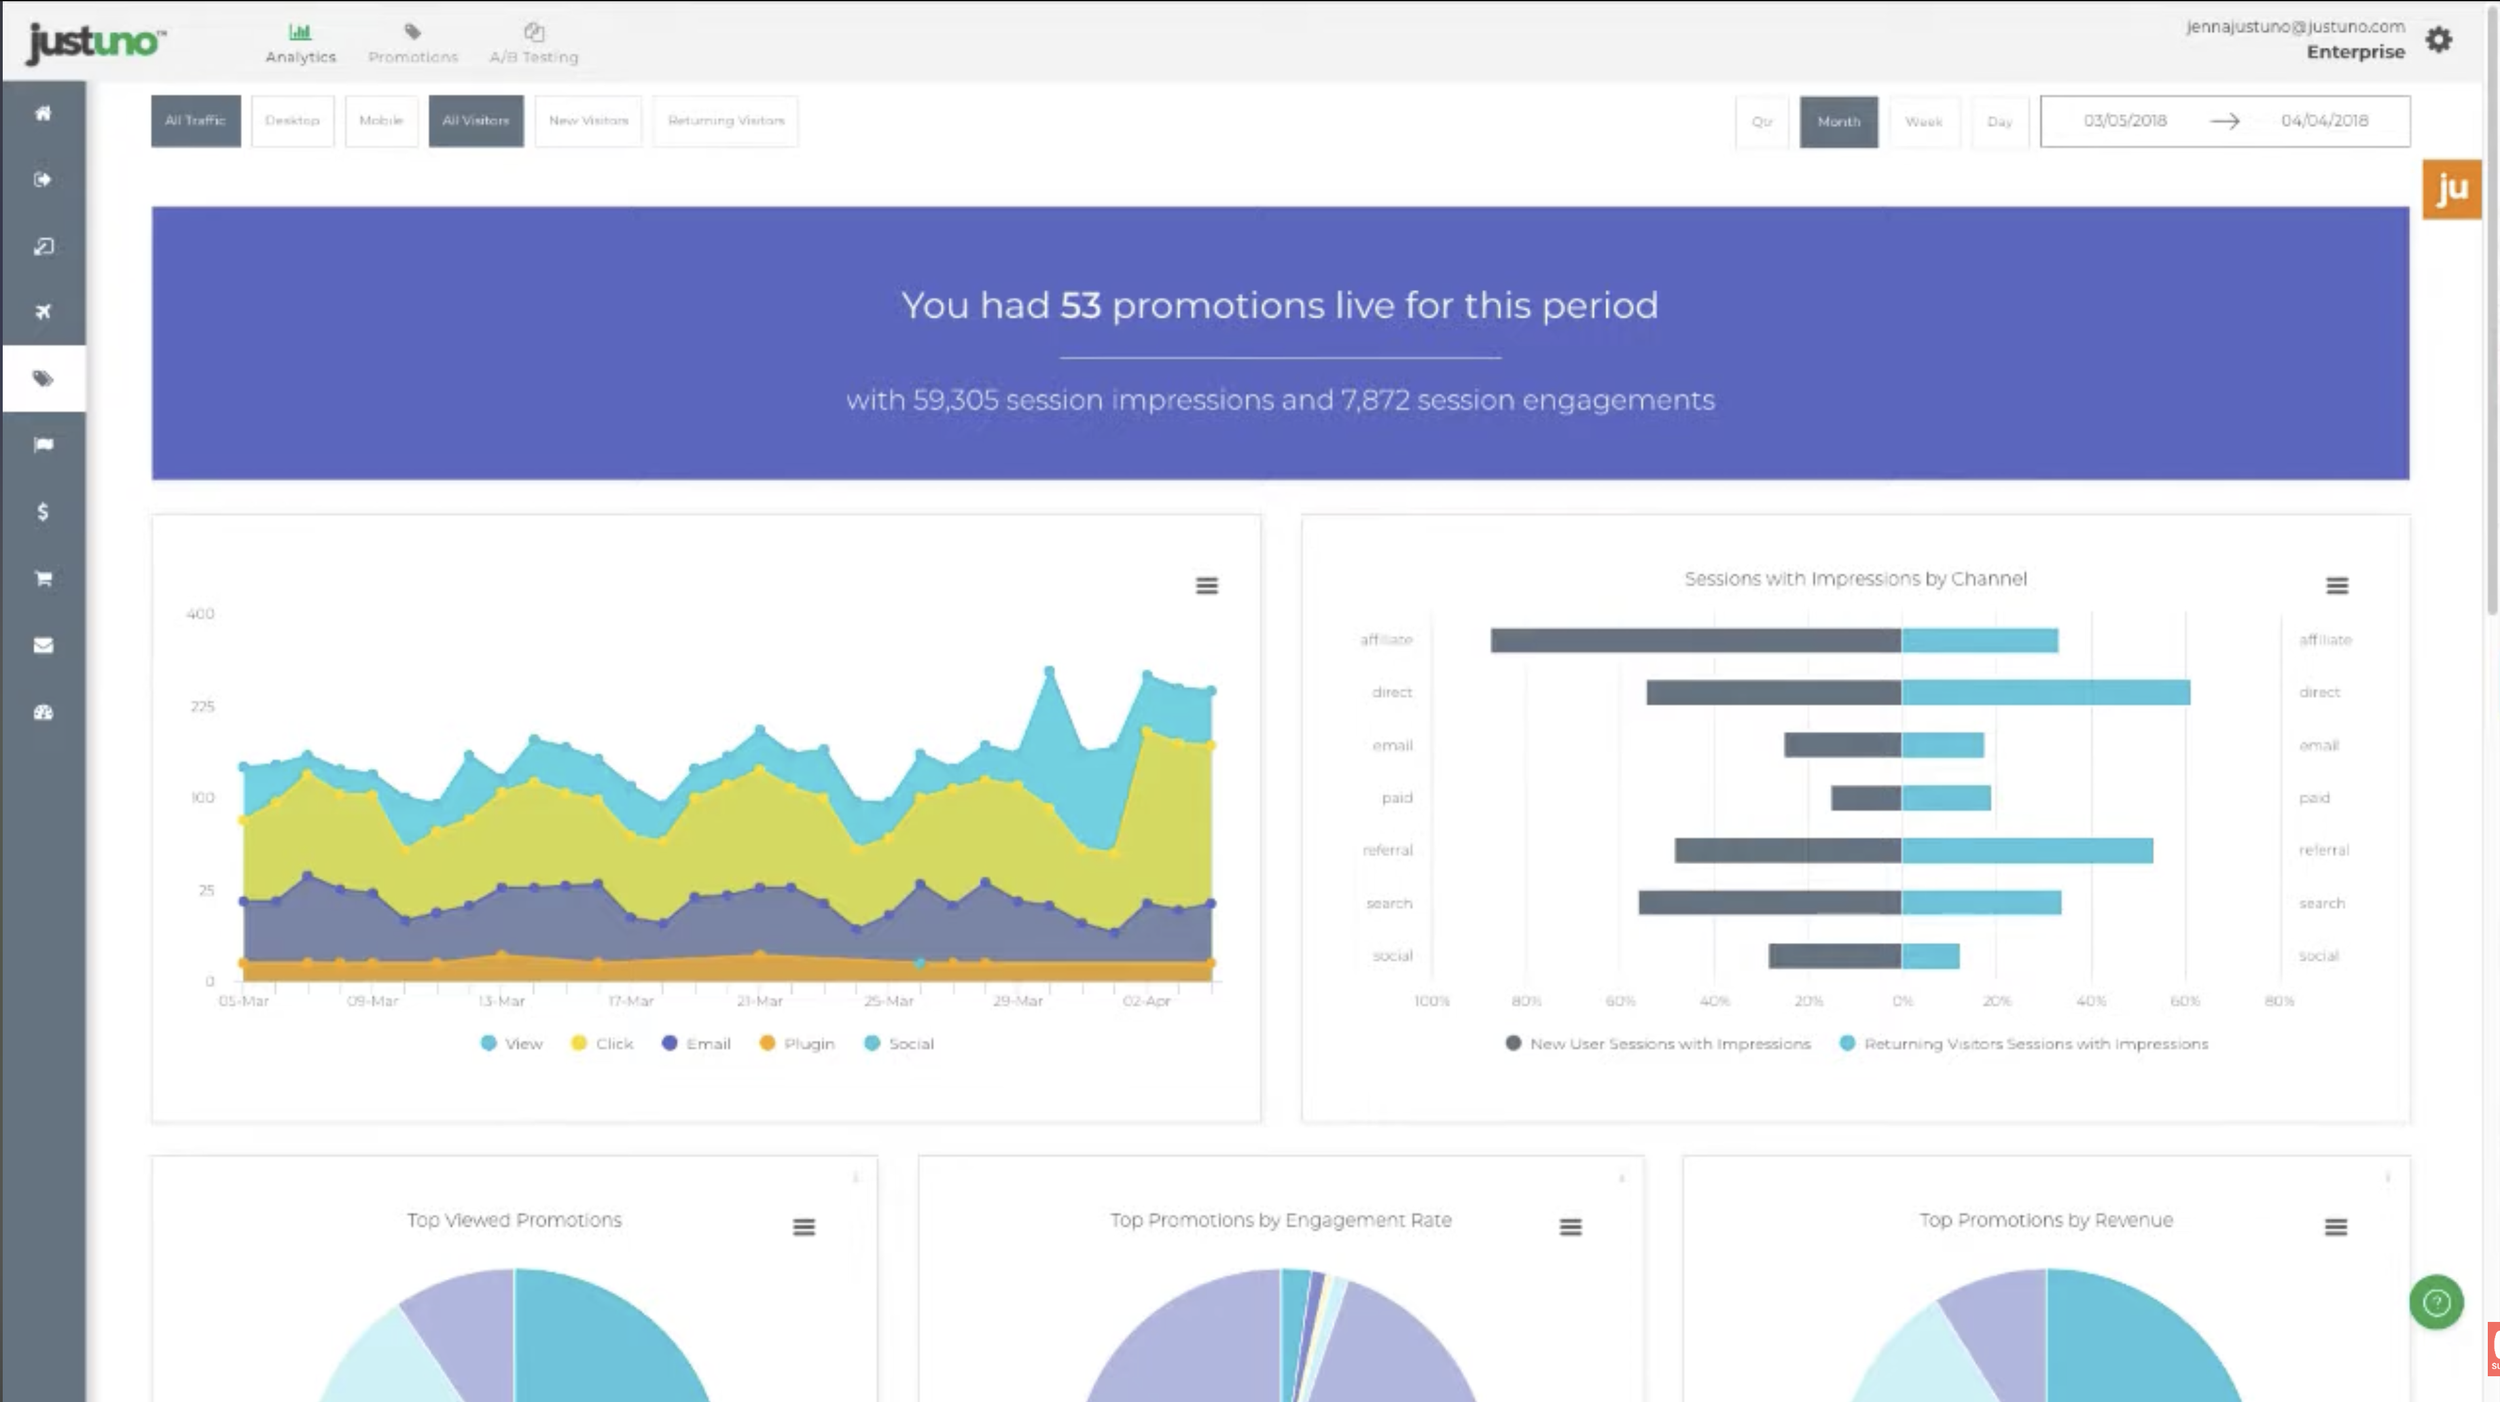

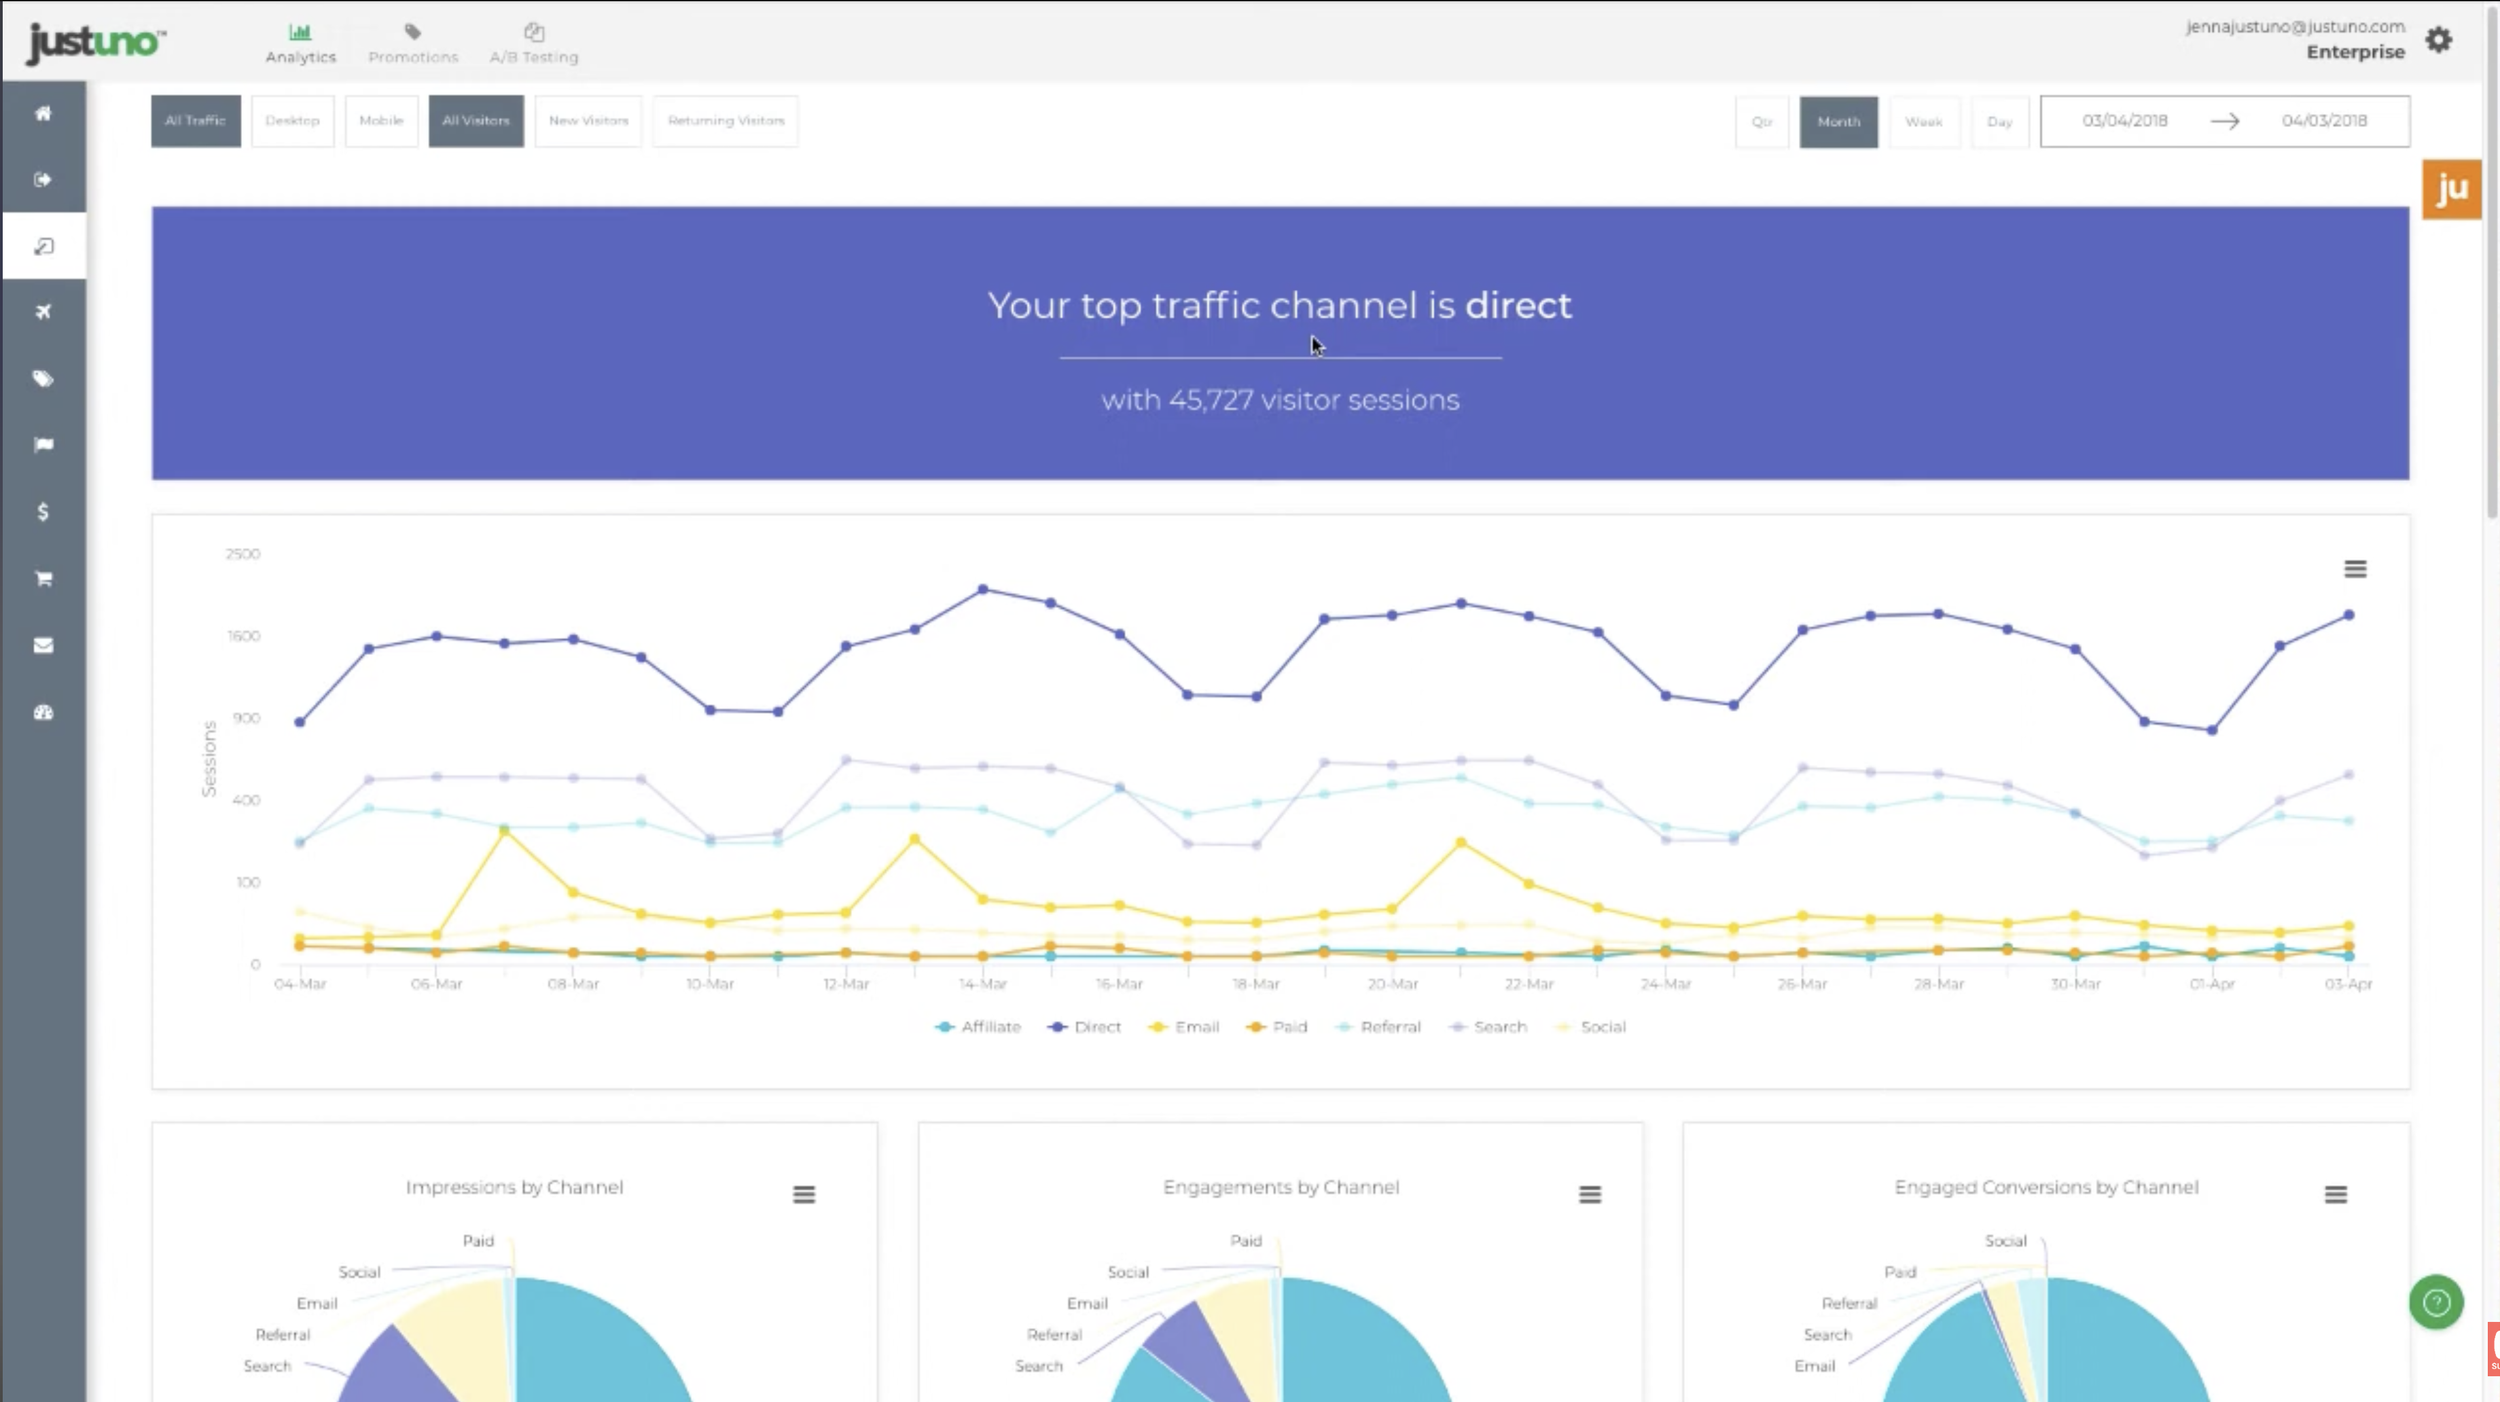
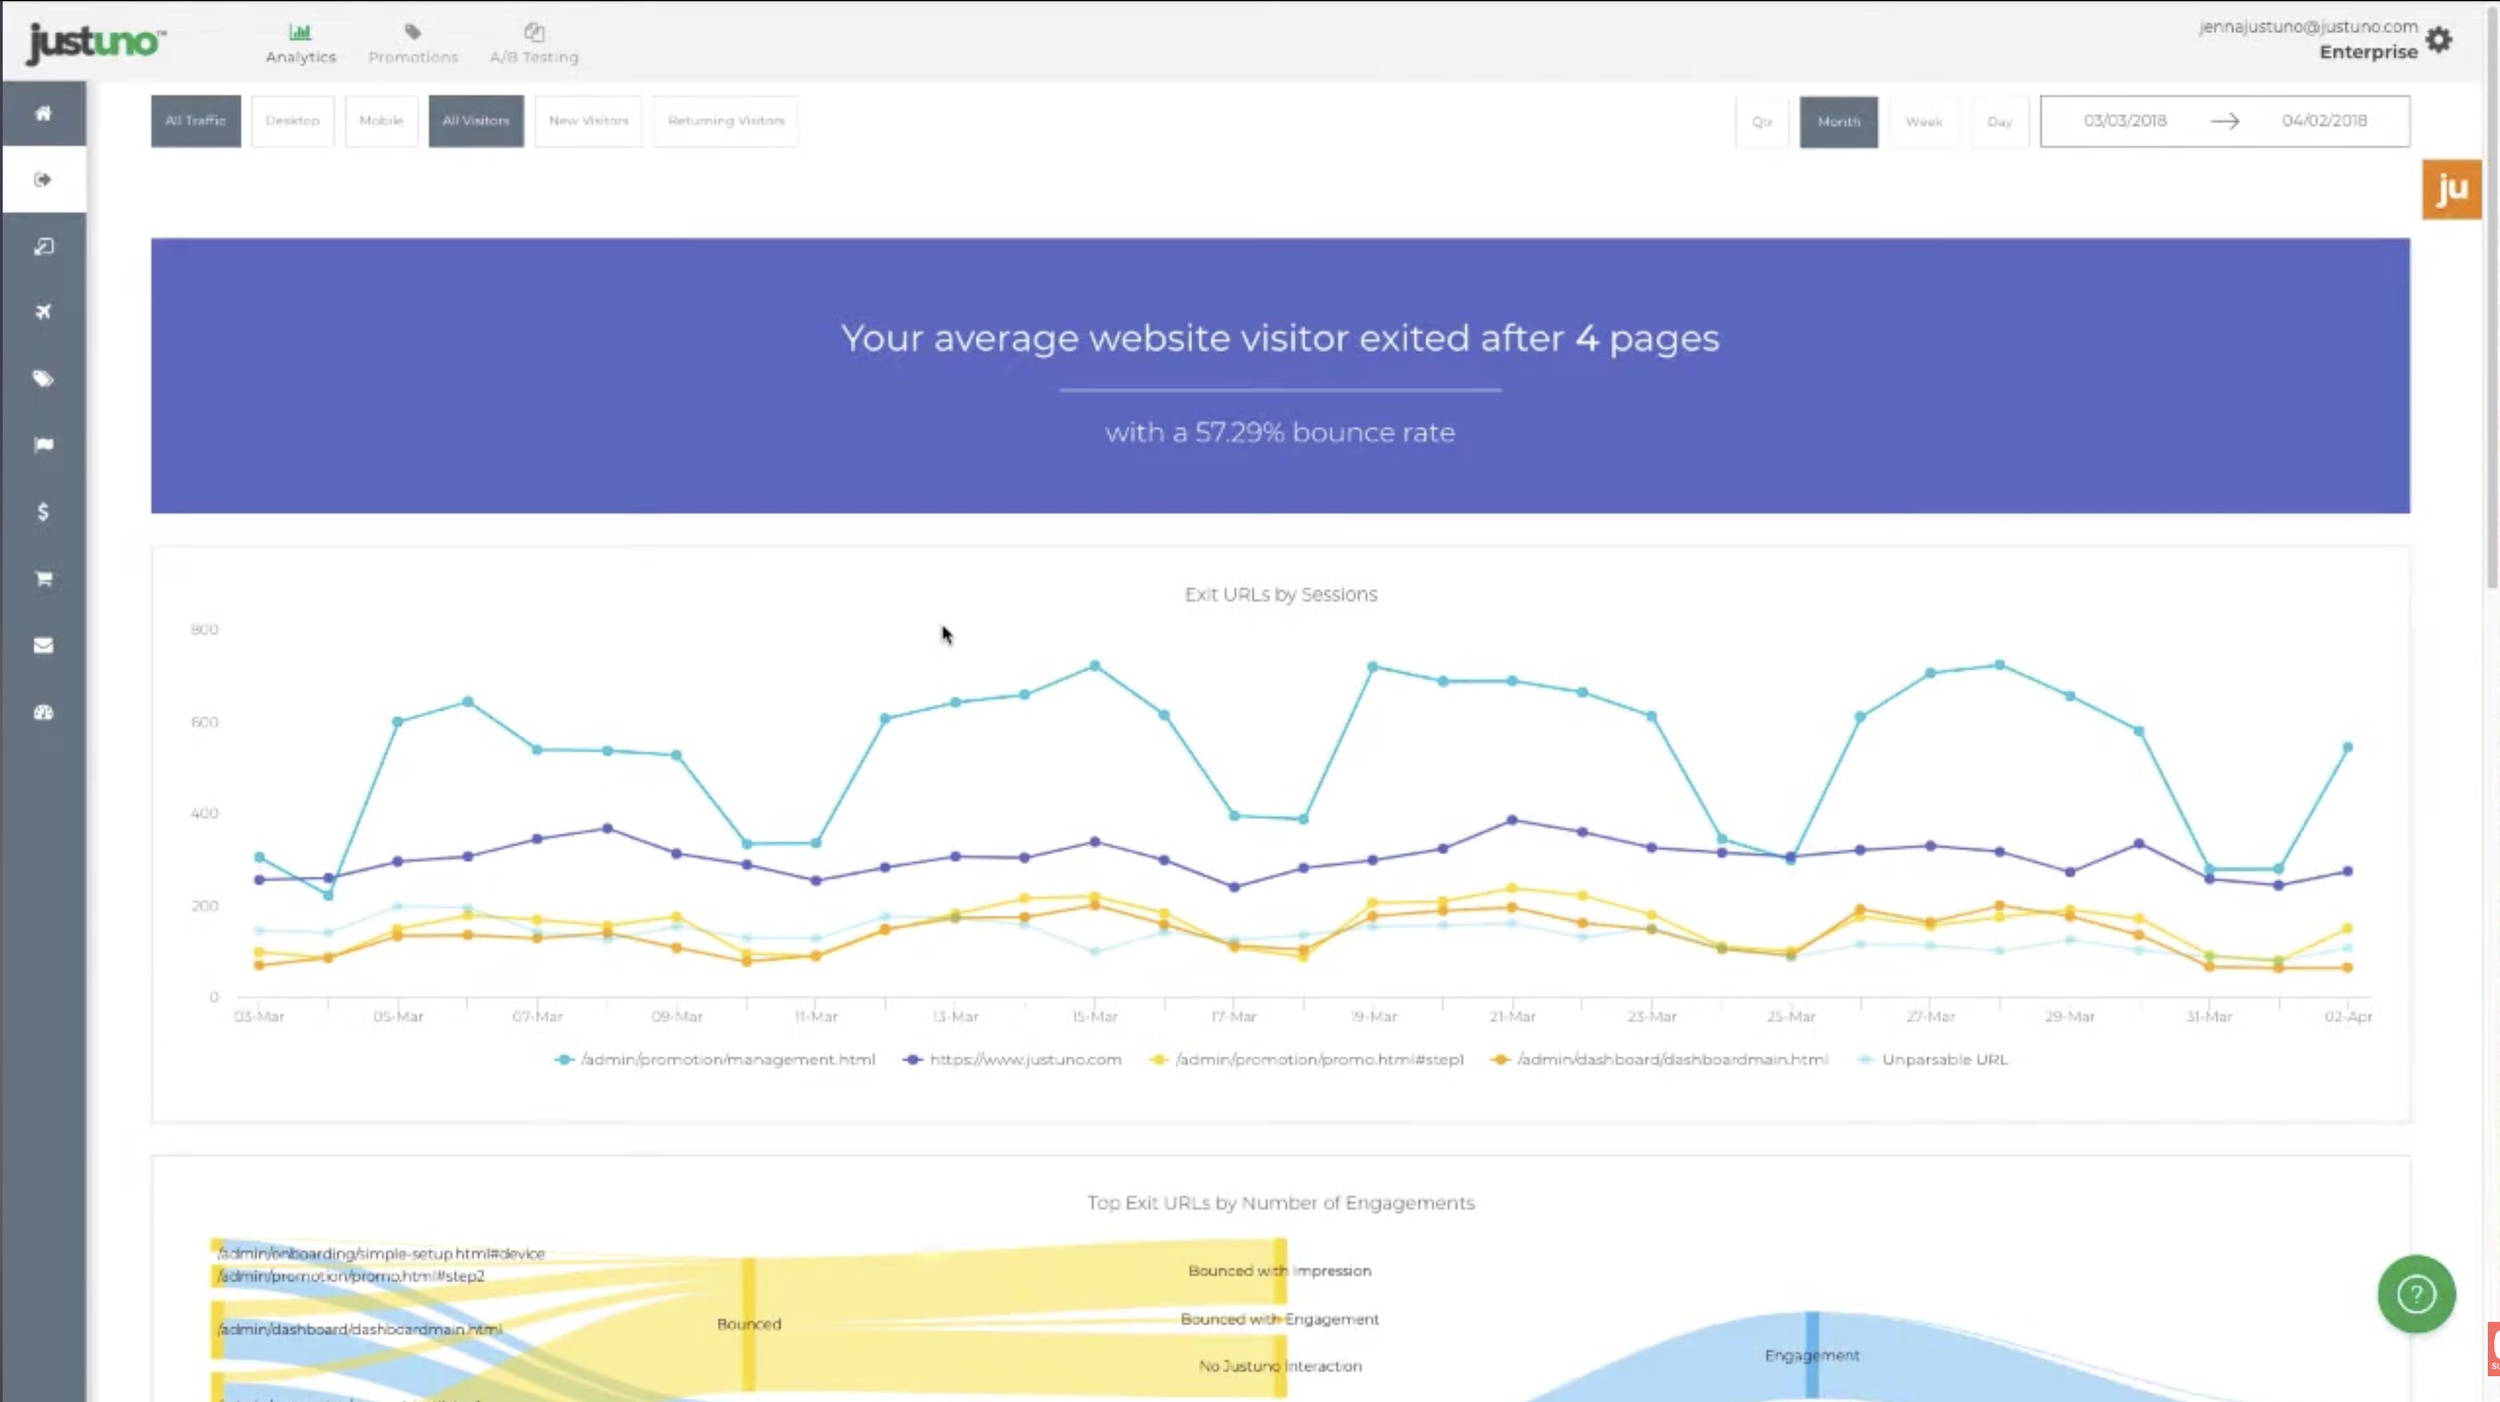
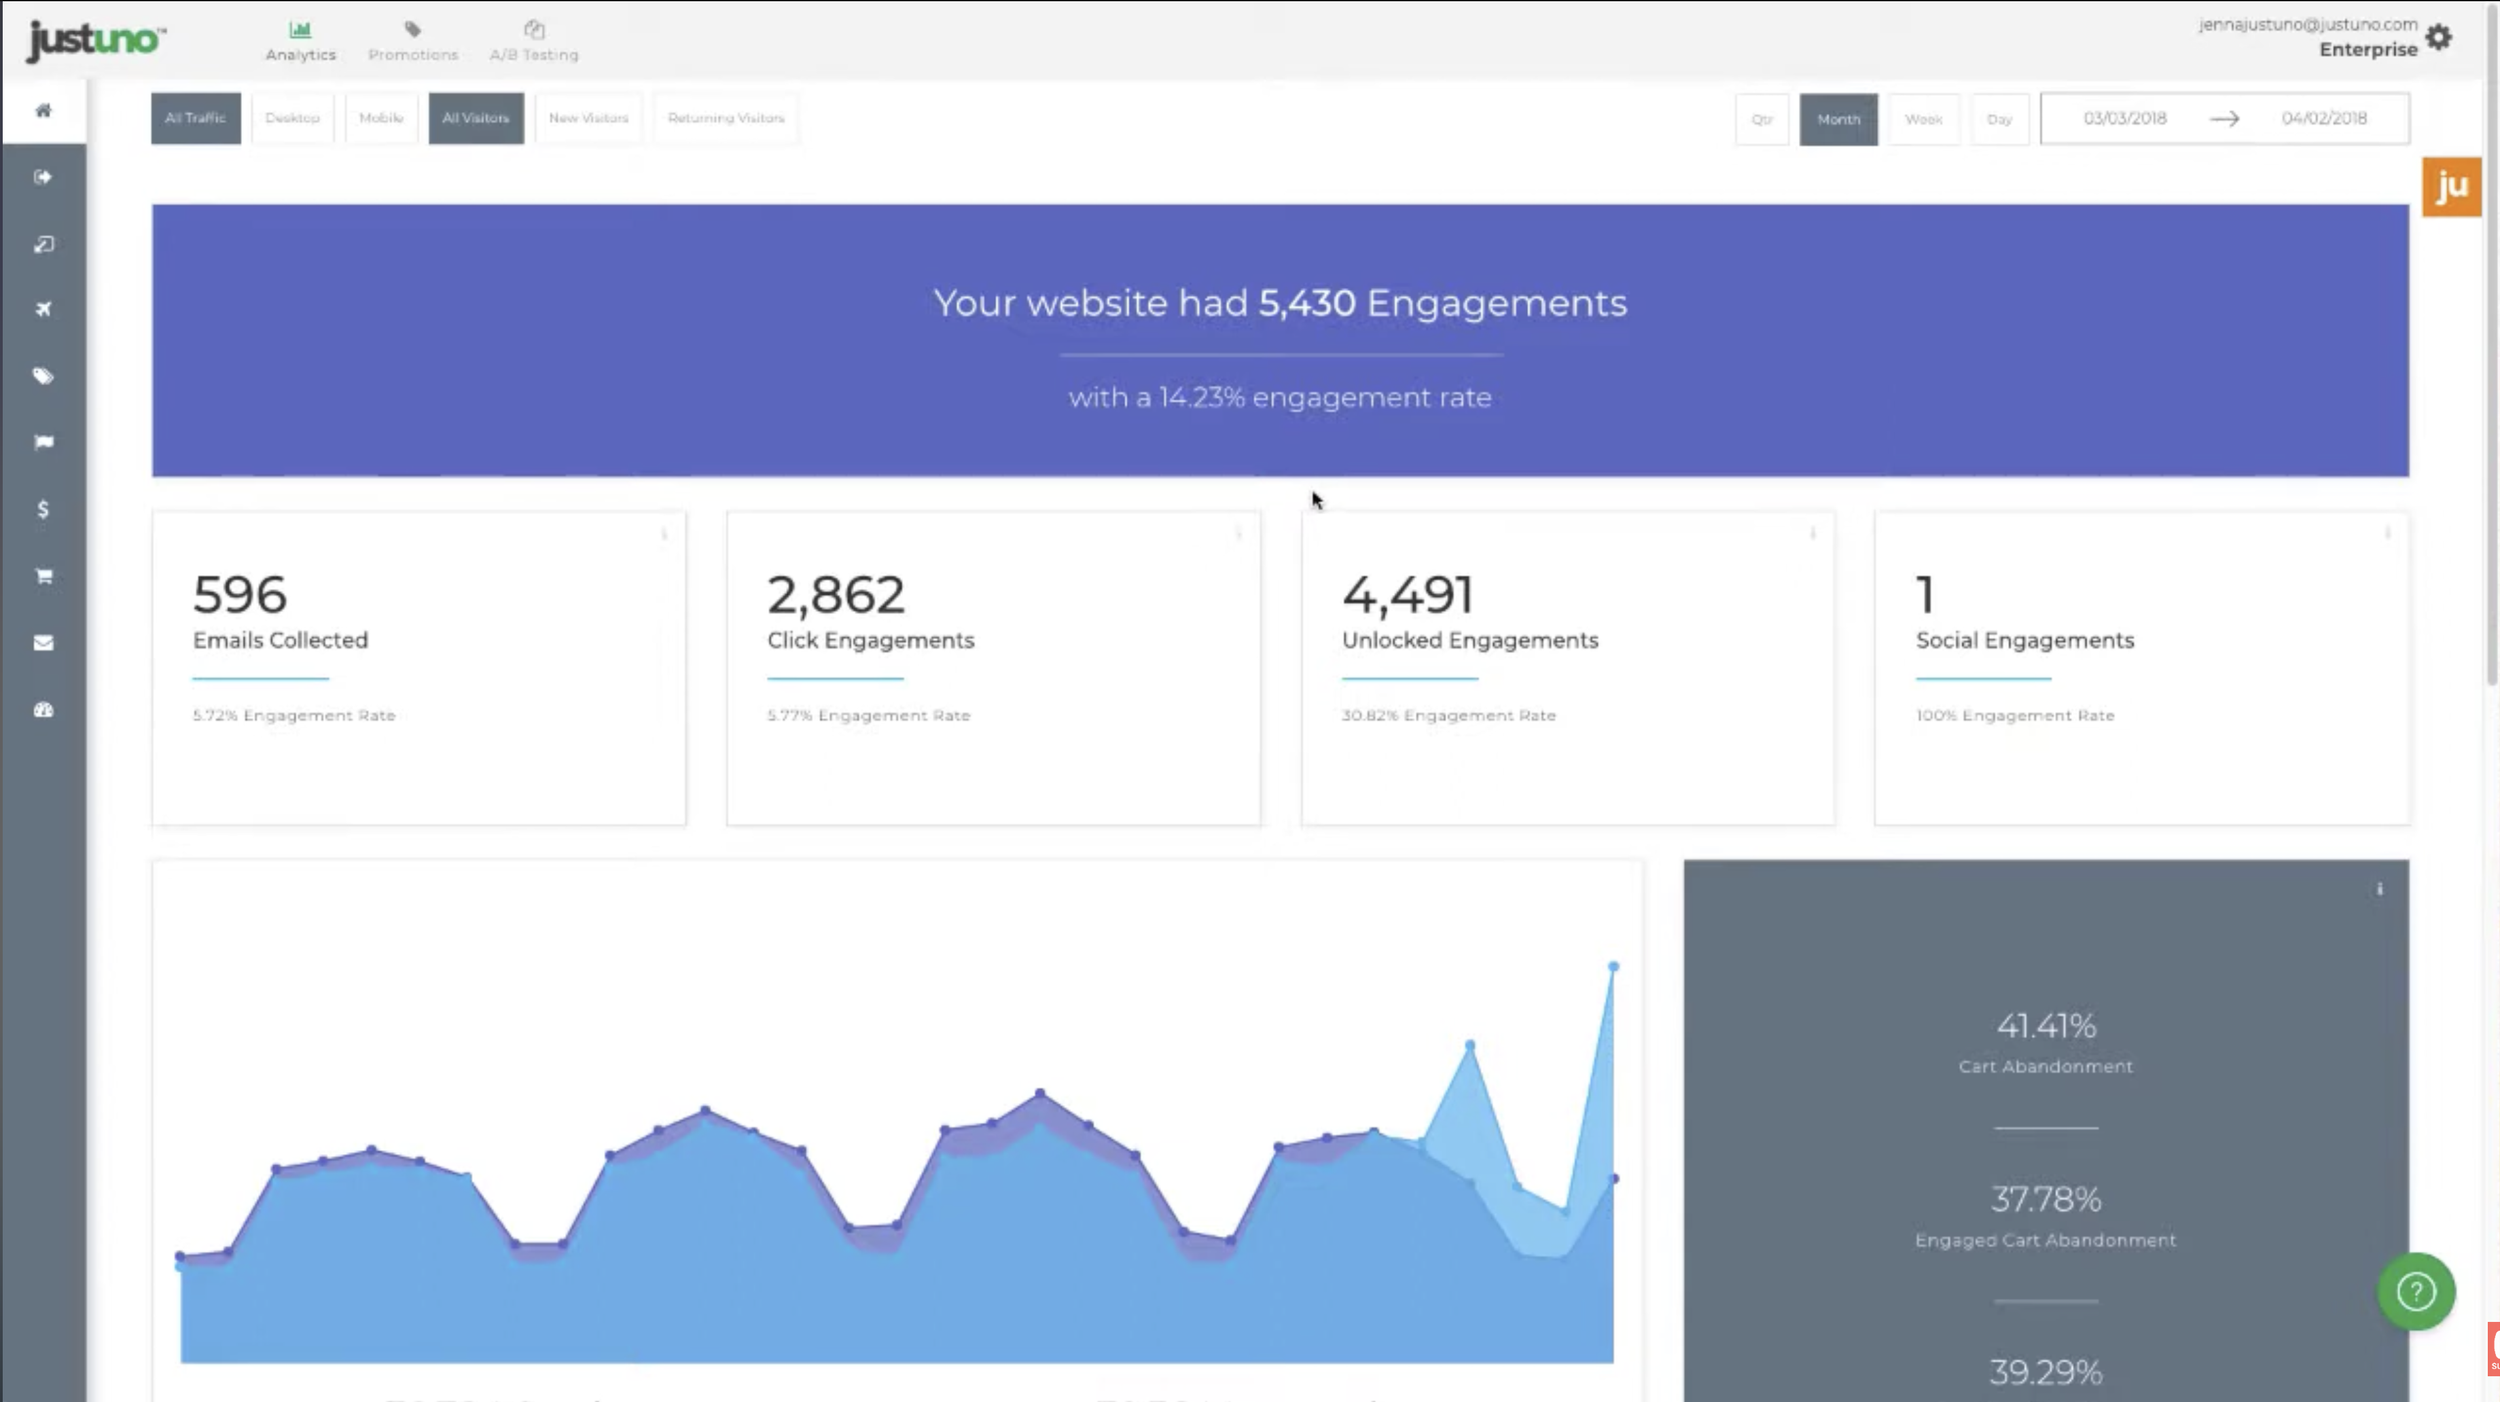
The platform covered the full range of e-commerce analytics, traffic, conversions, engagement, and promotion performance, presented through a consistent visual system of charts, graphs, and data summaries designed to be readable at a glance without losing depth for clients who wanted to dig in.
Two pieces stand out as the most technically interesting.
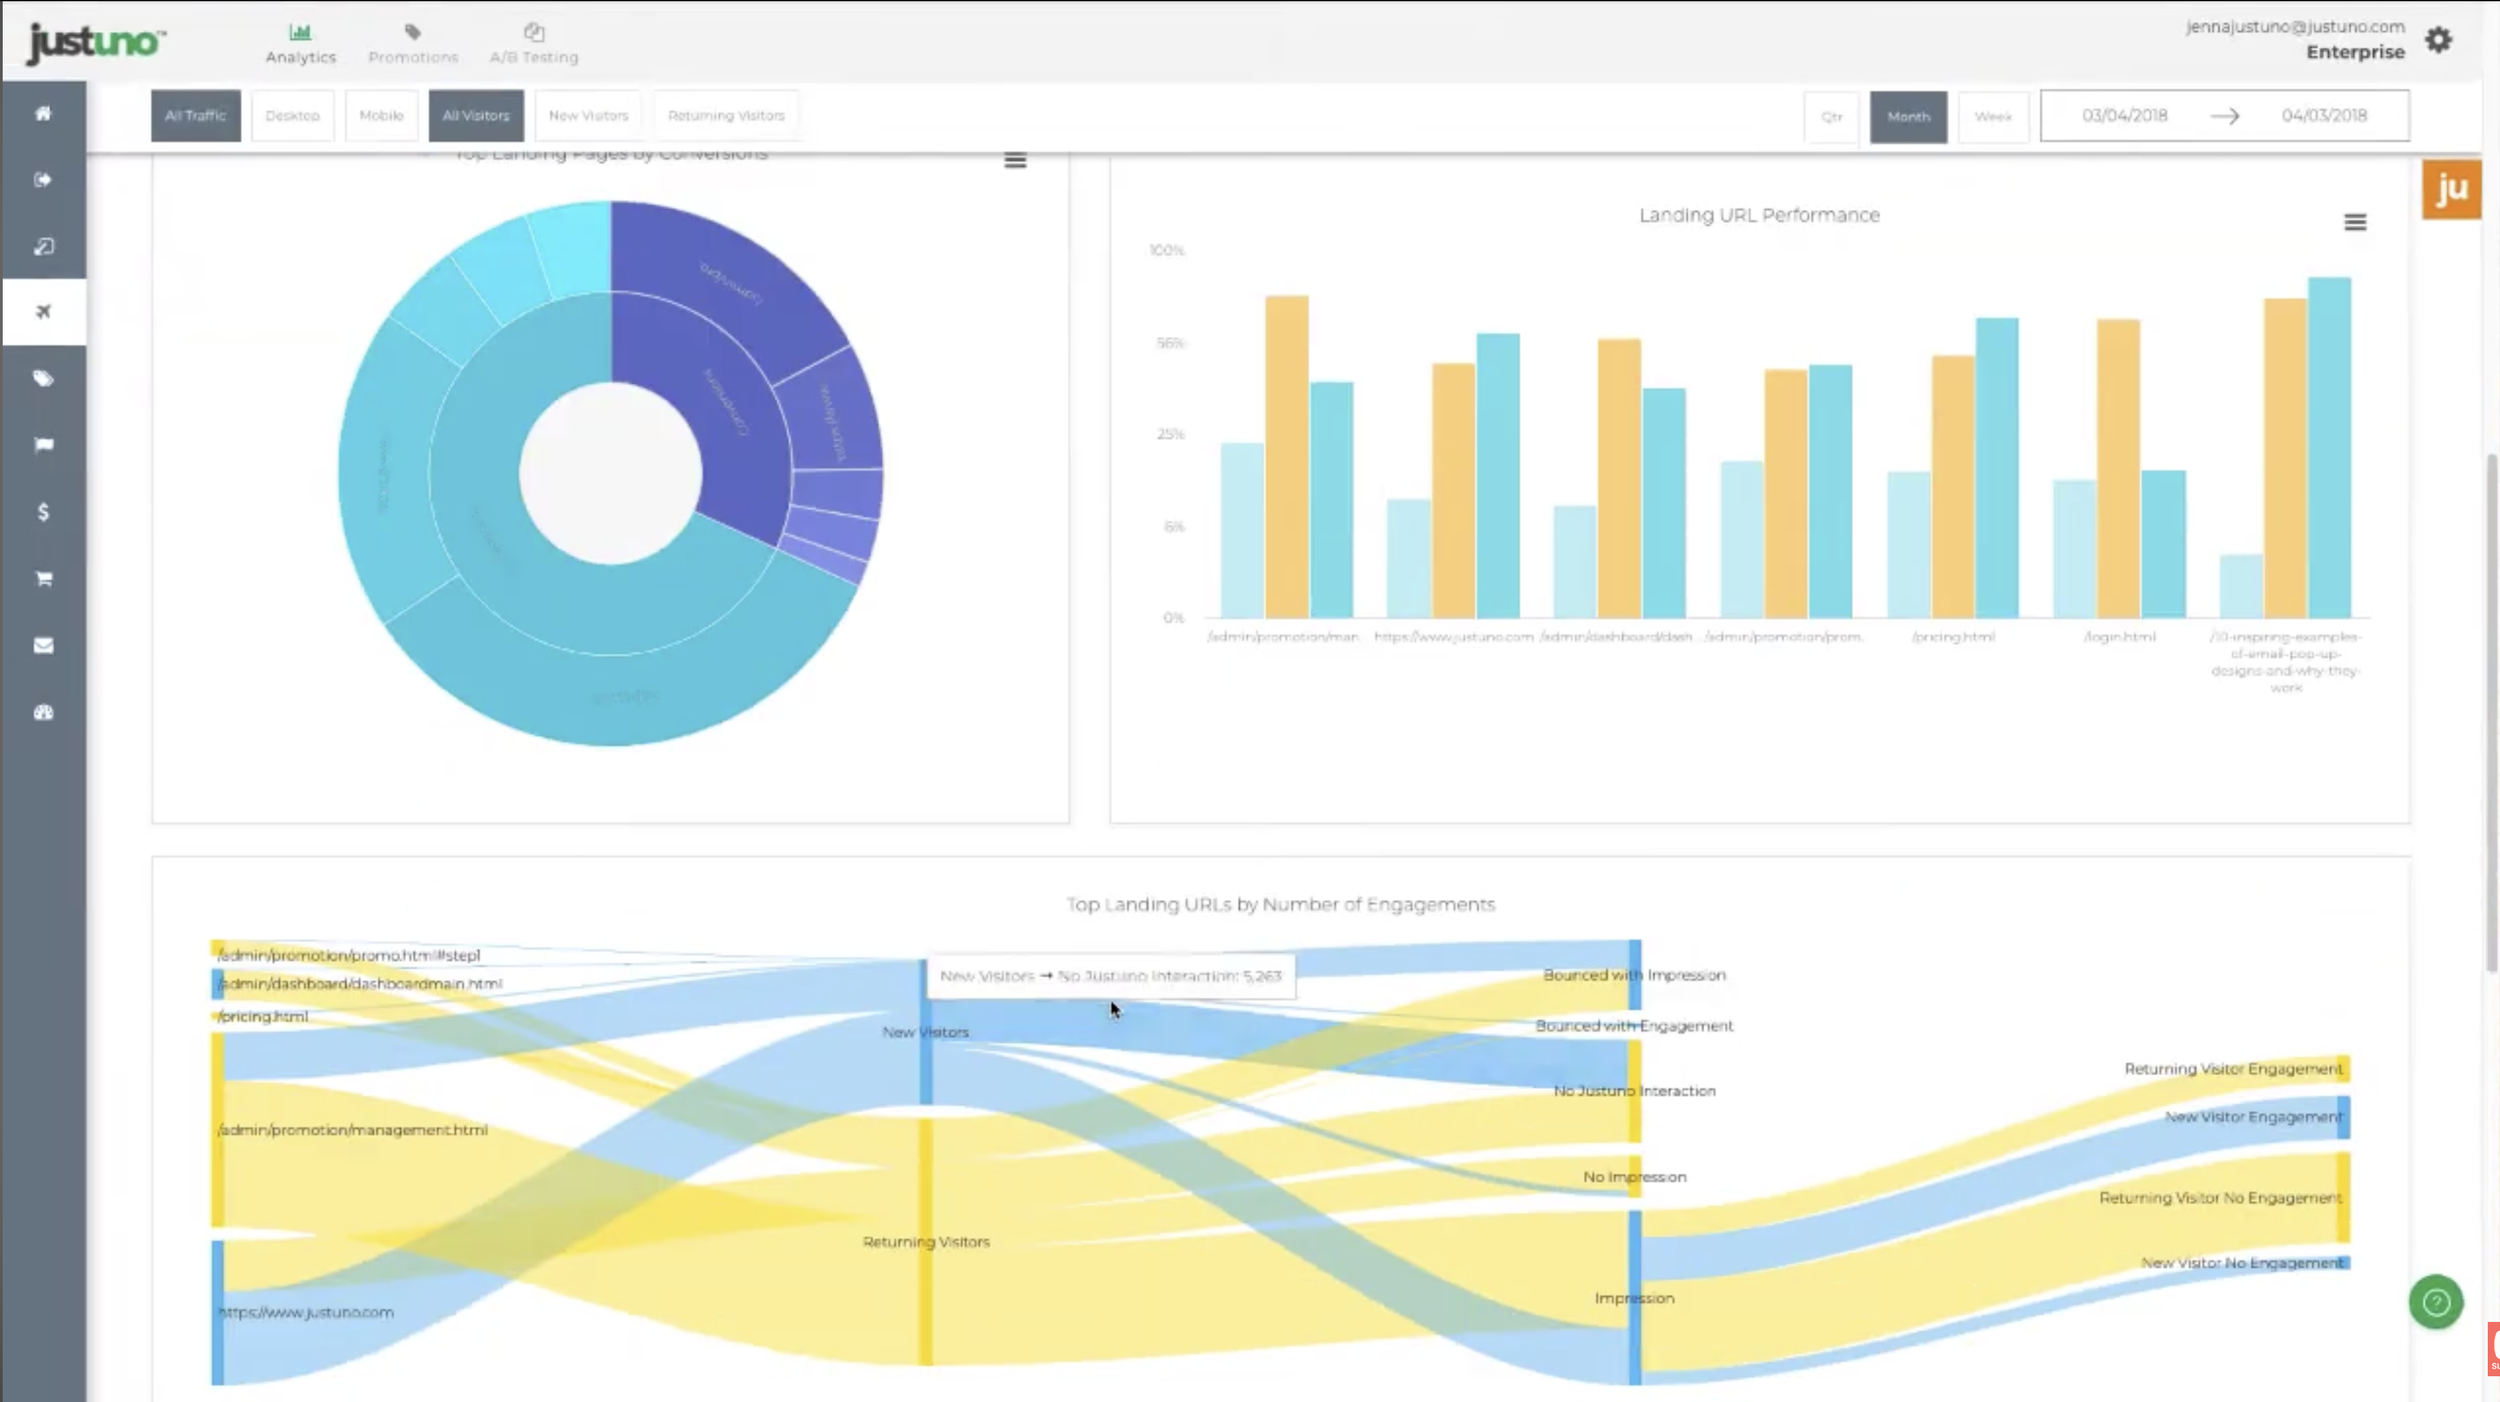
The date picker took real effort to get right. It needed to feel simple to use while handling the complexity of filtering data across the entire platform simultaneously. The other was a visitor flow visualization that mapped the actual path a visitor took through a site and showed exactly how they interacted with promotions at each step. It was one of the harder problems to solve and one of the more compelling things to look at once it worked.
The Outcome
Nothing in Justuno's competitive landscape came close to this level of analytics at the time. That was a significant reason for clients to stay on the platform and a genuine differentiator in a crowded market.
The data the platform surfaced also fed directly into other parts of the product. Insights that were previously invisible became inputs for targeting, segmentation, and optimization tools elsewhere in the app. Building the analytics platform was not just about giving clients better reporting. It made the rest of the product smarter.